What is a correlation? And data analysis tools

When information of a dataset are analysed, whose origin or “feed” may be a database, information of raw files, logs, spreadsheet data, etc. one of the most powerful tools for drawing conclusions is to carry out correlations.
In the post “The importance of language, binary diffing and other “One Day” stories”, we highlighted that the term “correlation” has begun to be heard frequently. However, sometimes, the analyses, definitions, references and even software that claim to perform these calculations are not accurate. An example in security is the case of some SIEM tools, or similar tools, that claim to perform correlations, when, on occasion, they are actually carrying out another type of analysis technique. These tools usually have consultation execution modules, either in SQL, in a language of the tool, or even in pseudocode, that cannot carry out an analysis or correlation calculation.
What is it?
It is a statistical-based, and thus, mathematics-based information analysis technique. It consists of analysing the relationship between at least two variables, e.g. two fields of a database or of a log or raw data. The result will display the strength and direction of the relationship.
To analyse the relationship between variables, “correlation coefficients” are used. These coefficients are calculated on quantitative or qualitative variables. This will determine whether Pearson’s correlation coefficient, that of Spearman, or that of Kendall is calculated. This is if we are dealing with bivariate correlations. There are others, such as correlations or measurements of distance or dissimilarity of intervals, counts or binaries (e.g. Euclidean distance, Euclidean squared, Chebyshev, Block, Minkovsky, etc.)
It is a widely documented technique, with many sources of information open for anyone to access their principles and carry out their own analyses.
To date, the application of the correlation has been very wide and diverse in different fields, such as natural science, economics, psychology, etc. and, of course, in research of all kinds. With regard to the field of information security, the bases are the same, although for the moment, it is still being developed.
Mathematical principles of the correlation:
We will analyse the most typical case of two quantitative variables. The relationship may be linear, polynomial, logarithmic, etc. For it, we use the Method of Least Squares. It consists of minimising the error of the relationship calculated compared with the reality, that is, minimising the standard deviation of the regression residuals (Mean Squared Error).
![]()
ei is the difference for each element between the real observation and the estimated datum ![]() , and n is the number of elements observed.
, and n is the number of elements observed.
Thus, applying a linear adjustment,
![]()
In the simplest case: with a dependent variable and an independent variable, we would have
![]()
Resulting from this is Pearson’s Correlation Coefficient, the best-known correlation coefficient:
![]()
σxy is the covariance of variables X and Y,σx is the standard deviation of variable X,
and σy is the standard deviation of variable Y.
The values that can take R are: -1≤R≤1
- R=-1: there is a perfect negative relationship.
- -1<R<0: there is a negative relationship..
- R=0: there is no relationship, there is no linear relationship, given that Y does not depend linearly on X. In this case, it is important to highlight that if two variables are independent, R=0, but the contrary does not need to be true, that is, R=0 does not necessarily mean that X and Y are independent.
- 0<R<1: there is a positive relationship.
- R=1: there is a perfect positive relationship.
We can also make use of the following ranges:
- R=-1: there is a perfect negative relationship.
- -1<R<-0,5: there is a strong negative relationship.
- R=-0,5: there is a moderate negative relationship..
- -0,5<R<0: there is a weak negative relationship.
- R=0: there is no relationship, there is no linear relationship, Y does not depend linearly on X.
- 0<R<0,5: there is a weak positive relationship.
- R=0,5: there is a moderate positive relationship.
- 0,5<R<1: there is a strong positive relationship.
- R=1: there is a perfect positive relationship.
There are many methods to analyse the relationship between variables, such as:
- Linear Regression.
- Non-linear Regression.
- Logistic Regression.
- Probit Models.
- Contingency Tables.
- Logarithmic Models.
Examples of sources of Information with explanations about the correlation:
- [MIT]: Correlation and Regression
- [MIT]: Correlation and Regression (2)
- [MIT]: Regression Analysis: Method of Least Squares
- [MIT]: Correlation Analysis
- [MIT]: Tests for the Regression Equation
- [MIT]: Probabilistic Systems Analysis and Applied Probability, Derived distributions, convolution; covariance and correlation
- [WIKIPEDIA]: Correlation and dependence
What is needed for carrying out a correlation? What are the minimum requirements?:
Knowing the data and the type of variables: either quantitative or qualitative. Depending on the type of variables of the dataset, a series of coefficients or other will be applied.
Knowing which method is the most appropriate for application: it is pointless knowing the script that runs a correlation if we cannot base in mathematics the way calculations are performed.
Knowing, understanding, and interpreting the results that the indicators provide: this is a key part of the analysis, based on the underlying difference between the concepts of causation and correlation in the analysis, which are often confused. The mere calculation of a coefficient, not determined by causation, is not necessarily valid. That is, the “existence of correlation does not imply causation”, as is shown in this cartoon:
- The first element is a “dataset”.
- In this dataset, it is necessary to have at least two “variables” (this is the technical name); depending on the technique, they have been called database “domains”, “fields”, and similar.
- Knowing the mathematical and statistical principles of the data analysis, specifically:

What is not a correlation? examples:
1. A frequency analysis:
Carrying out a count, technically known as “ordinary or cumulative frequencies” and “absolute or relative frequencies”. In their multidimensional mode they are completed with “marginal and conditional frequencies”. This is the most common case, reflected in the SQL or Python typical instruction, whose result is an aggregate COUNT or SUM.
A practical example of what a correlation is not in security: counting the number of IP addresses blocked by a certain filter within a database or a system log, when the number of connections to a specific “network destination address” surpasses a maximum established threshold from a certain location (“source address” or geographical location). This is not a correlation, it is a mere frequency analysis, in this case absolute, ordinary, and conditional, since it is multidimensional, with an appearance threshold being established. The threshold is nothing more than a quantile, the most used of which are percentiles, the same used by the paediatrician, calculated on conditional frequency.
2. Drawing a graph, such as the standard "frequency histogram" or pie chart with absolute percentages or values. Neither are what are nowadays called “Visual Representations”. In general, these tools provide the representation of a result, improving its comprehension, but they do not necessarily refer to a correlation analysis. In fact, the first graph is usually carried out for the correlation analysis, depending on the number of variables, e.g., in the case of two variables, it is a “scatter plot”. Although this diagram is not a correlation, it is the first step to knowing the potential existence of a relationship or independence between the variables.
It is usually common for the analyst to prefer a simple results data table that contains everything necessary for making decisions, given that it will be the latter that will supply the graph, which will normally be that which is presented to third parties.
3. Statistics provides us with other more adequate tools. An example of this is to compare the frequency over time of sending spam from a certain IP, and analysing whether its statistical, not geographical, distribution in accordance with a certain parameter has been modified, and determine whether the establishing of a filter has worked or whether it is necessary to modify it, change it or eliminate it. This is not carried out by a correlation; there is another more appropriate technique called “Statistical hypothesis testing”, which we will talk about another day, and we will show real cases, using SIEM data. Resulting from this technique are concepts that are also widely used, such as “False positive” or “False negative”… any e-mail server administrator can attest to how costly it is to apply this technique to parametrise the rules that define each one, and for these filters to function correctly, but never perfectly.
Tools and software for an analysis of data and correlations:
A correlation is nothing more than one of the existing techniques that exist for data and information analysis. The tools most used for analysing data are:
- Simply a sheet of paper and a pencil, with a calculator beside us to help us ;-)
- When the dataset contains a high number of records, or becomes a multidimensional model, is the time when it is most efficient to use software. Do not forget that there is no use at all in knowing the instructions if we do not know the data, type, and mathematical basis that develops the calculations, neither are we capable of understanding or interpreting the results that the indicators give us.
There are currently many tools for carrying out this kind of data analysis:
- Spreadsheets: for small datasets, although they are not prepared exactly for it, but rather for more general use, and it has the limit of their finite data field.
- R: Interpreted programming language for statistical and graphic analysis, with GUI modules, such as R-Commander (Proyecto R).
- SPSS: IBM analysis software, with its own interpreted language. (SPSS)
- SAS: “statistical analysis systems” analysis software with interpreted language of the company of the same name. (SAS)
- Python: it is not really a tool, it is an interpreted programming language, but through its current diffusion, data analysis libraries are being designed in it, and, due to its versatility, it can be integrated into processes of the abovementioned tools. However, this is a small disadvantage, given that as a language, it is designed for non-technical general use for data analysis. (Python)
- Others: for example Matlab, Stata, etc. There are many tools and information about these tools; the following links provide a comprehensive list, whose technical characteristics can be compared:
The Popularity of Data Analysis Software
Which Big Data, Data Mining, and Data Science Tools go together?
Advantages: the most important aspects in choosing a tool include:
- The possibility of having the calculation modules of most of the analyses that can be carried out predesigned, from simple frequency calculations to all types of multidimensional analyses or time series.
- Some of them –most of which we have mentioned- have their own interpreted language, which allows the analysis to be personalised and tasks, calculations, and analyses to be automated. This is key in continuous calculation processes, as well as the typical advantages of using scripts versus using GUI.
- Processes or libraries of other tools can be embedded in some of the tools commented, for example, Python can be used within R and SPSS.
Which is the best? It will be the data scientist’s decision to determine which tool to use. As has always occurred in the universe of software, each has its advantages and disadvantages. Amongst those of open code there are many choices, and as it says there, the best “it’s up to you”.
The size of the dataset –number of records and variables-, the possibility of having an interpreted language, whether it is open source or not, and hardware requirements are only some of the characteristics that must be taken into account for selecting one or another.
Examples of Scripts that carry out correlations (reeling off commands one by one):
In R:
- We load the data from a text file, with two variables, with the data being separated by tabs:
![]()
- We execute the correlation calculation, which calculates Pearson’s correlation coefficient:
![]()
In SPSS:
- We load the data from a sav file:
![]()
- or we load the data from a text file, with two variables, with the data being separated by tabs:
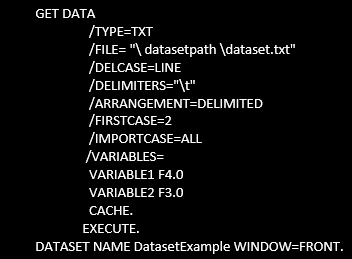
- We execute the calculation of the correlation, which calculates Pearson correlation coefficient:
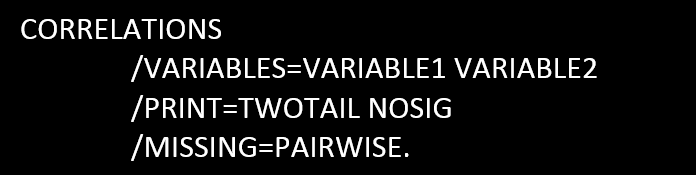
- After carrying out the calculations, the results must be interpreted, as we mentioned above in this post.
Examples of scripts that are not a correlation:
In any language or application, they are those whose final consultation structure resides in a COUNT or a SUM or an aggregate of them, given that this is no more than a calculation of frequencies:
In SQL
![]()
In Python:
![]()
And what knowledge is needed to carry out a data analysis and a correlation using security data? There are list that recommend having skills in some subjects or others. In general: Maths, and its “younger sister” Statistics, Information Security, IT, databases, calculation software, analysis languages and tools (R, SPSS, SQL, Python, etc), standardisation, debugging and filtering data techniques, and data analysis, ... and really having a multidisciplinary team that shares this knowledge, without which this blog post, and future entries, would not have been possible.
In future posts, we will present real examples of correlations and hypothesis test on security data collected in a SIEM, carrying out an analysis that has the calculation and comparison of validity on the correlation parameter, so that the following doesn’t occur:
- Bob: Great! After thinking about it and calculating all night, I’ve got it: I have obtained a Pearson’s correlation coefficient of 0.98!
- Alice: Come on, leave that and come and have breakfast... you have just demonstrated that children are delivered by the stork from Paris.
(Note: the variables that Bob used were the stork populations, the number of childbirths, and the number of churches (storks in them) in a certain location).